Where it started
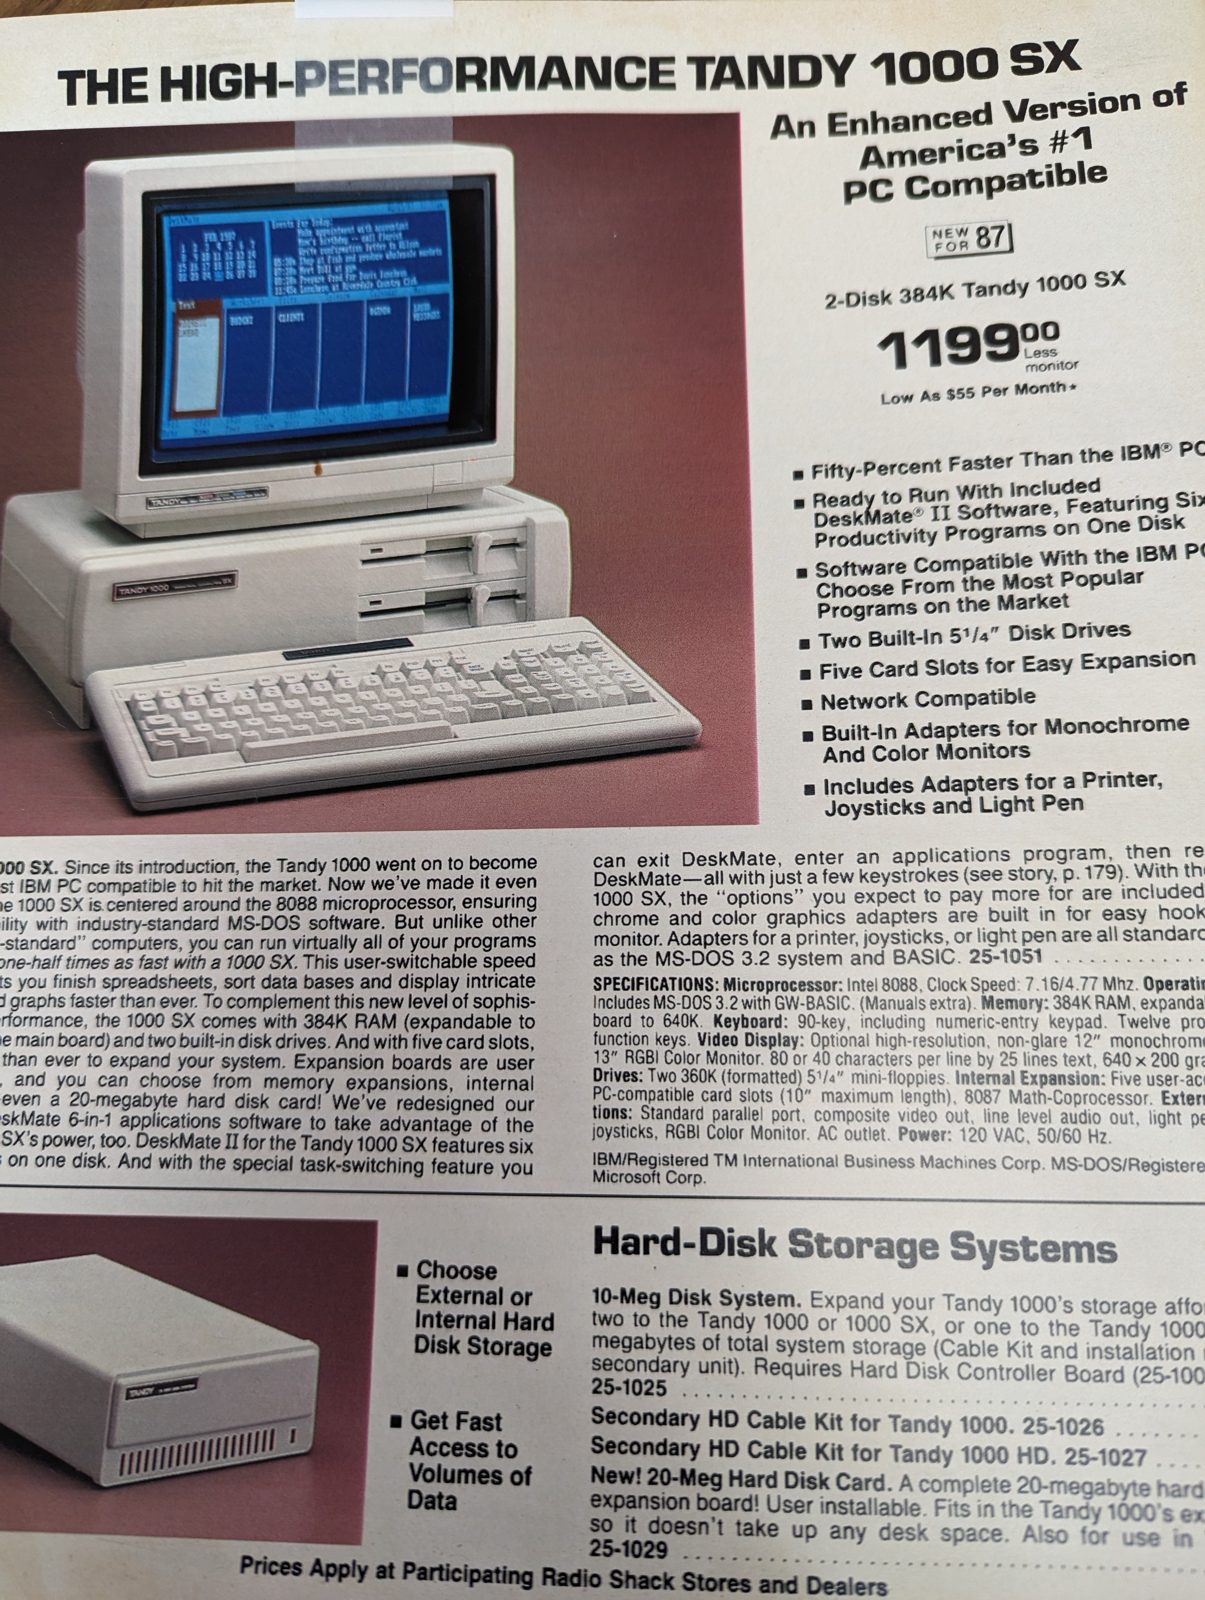
- Spent Saturday mornings on a TRS-80
- Worked at Radio Shack through high school and college
- Then a high school science teacher in Nebraska
- Now Professor of Educational Technology at UNLV
A pick-your-path tour for early doctoral students
Click a tile or press 1 to 6. Arrow keys move through a section. Esc returns to this map. F toggles fullscreen.
Section 1 · About Kendall · Back to map

Section 2 · What you told us · Back to map
Number of respondents (of 16)
TakeawayGeneral chatbots are already common. Citation managers and research-specific AI tools are not.
"Where do you lose the most time? Pick up to two." (Most of you picked more than two things.)
TakeawayReading is the bottleneck for nearly everyone. Remembering what you read is next.
"How interested are you in each? (1 = not interested, 5 = very interested)" (Average of your ratings.)
TakeawayThe top two became the two deep dives. Citation managers and sensitive data show up in the last section.
Number of respondents at each level (1 = not at all, 5 = very)
TakeawayAverage 2.8. High interest, low comfort.
Section 3 · How fast this is moving · Back to map
Households with a computer and Internet use, plus smartphone ownership, 1984 to 2021 (percent).
| Year | Computer at home | Internet at home | Smartphone |
|---|---|---|---|
| 1984 | 8.2 | ||
| 1989 | 15.0 | ||
| 1993 | 22.9 | ||
| 1997 | 36.6 | 18.0 | |
| 2000 | 51.0 | 41.5 | |
| 2001 | 56.3 | 50.4 | |
| 2003 | 61.8 | 54.7 | |
| 2007 | 69.7 | 61.7 | |
| 2009 | 74.1 | 68.7 | |
| 2010 | 76.7 | 71.1 | |
| 2011 | 75.6 | 71.7 | 35 |
| 2012 | 78.9 | 74.8 | 46 |
| 2013 | 51 | ||
| 2014 | 55 | ||
| 2015 | 86.8 | 76.7 | 67 |
| 2016 | 72 | ||
| 2018 | 77 | ||
| 2019 | 92.9 | 86.4 | 81 |
| 2021 | 85 |
Source: U.S. Census Bureau, Current Population Survey, select years (computer and Internet), and Pew Research Center (smartphone). Values are percents.
Five more years of data and two new generative AI measures (new values shaded).
| Year | Computer at home | Internet at home | Smartphone | ChatGPT use (Pew) | Gen AI use (Fed) |
|---|---|---|---|---|---|
| 2013 | 51 | ||||
| 2014 | 55 | ||||
| 2015 | 86.8 | 76.7 | 67 | ||
| 2016 | 89.3 | 81.4 | 72 | ||
| 2017 | 90.8 | 83.5 | |||
| 2018 | 91.8 | 85.1 | 77 | ||
| 2019 | 92.9 | 86.4 | 81 | ||
| 2021 | 95.0 | 90.1 | 85 | ||
| 2022 | 95.7 | 91.0 | |||
| 2023 | 96.1 | 92.1 | 90 | 18 | |
| 2024 | 96.6 | 93.2 | 91 | 23 | 44.6 |
| 2025 | 91 | 34 | 54.5 | ||
| 2026 | 44 | 61.8 |
New in the 2026 update. Rows before 2013 are unchanged from the original.
No Census estimates for 2020 or 2025 yet.
Source: U.S. Census Bureau (CPS to 2012, ACS 2015 to 2024), Pew Research Center, St. Louis Fed Real-Time Population Survey. Households for computer and Internet, adults for the rest.
Households with a computer, from the Macintosh to today
In 1984 about 8% of households had a computer. It took until 2000 to pass half of households.
Dotted lines run from each key moment to the latest point on its curve. Households.
Adding household Internet use, starting with the Mosaic browser
Mosaic appeared in 1993 and Netscape followed in 1994. Half of households were online by 2001.
Dotted lines run from each key moment to the latest point on its curve. Sources: U.S. Census Bureau, Pew Research Center, St. Louis Fed Real-Time Population Survey.
Adding adult smartphone ownership, starting with the iPhone
Social media followed a similar path. Adult use of any social media site went from 7% in 2005 to 50% in 2011, then leveled off near 72%.
Dotted lines run from each key moment to the latest point on its curve. Sources: U.S. Census Bureau, Pew Research Center, St. Louis Fed Real-Time Population Survey.
Adding generative AI use, starting with the public release of ChatGPT
Two measures: any generative AI use among adults 18 to 64 (St. Louis Fed), and ever used ChatGPT among all adults (Pew). Even the lower Pew line rises faster than home Internet did.
Dotted lines run from each key moment to the latest point on its curve. Sources: U.S. Census Bureau, Pew Research Center, St. Louis Fed Real-Time Population Survey.
Average rise per year from the key moment to the latest data point.
| Technology | Key moment | Years to 50% |
|---|---|---|
| Home computer | 1984 | 16 |
| Home Internet | 1993 | 8 |
| Smartphone | 2007 | 6 |
| Generative AI | 2022 | 3 |
The older technologies had decades to level off near 90% or more, which lowers their average slope. Years to 50% gives the same ordering.
Generative AI uses the St. Louis Fed series (adults 18 to 64). Sources: U.S. Census Bureau, Pew Research Center, St. Louis Fed Real-Time Population Survey.
Marker words in PubMed abstracts, compared with their 2022 rate.
"Delve" fell back after 2024 once it became a known tell. Detection studies now track hundreds of words at once.
Source: counts from PubMed (NCBI E-utilities), title or abstract, records with abstracts, retrieved Sept. 29, 2026. *2026 is January to September.
Share of PubMed Central papers showing signs of LLM-assisted writing.
Estimates come from shifts in word use and cannot separate light editing from full generation. Still a preprint.
Source: Holzwarth, González-Márquez & Kobak, arXiv 2608.10715 (2026), points plotted at mid-year and Dec. 2025. Disclosure: He & Bu, PNAS (2026).
Section 4 · Google Scholar · Back to map
Section 5 · Content and context · Back to map
Section 6 · Using AI with care · Back to map
"During the preparation of this study, the authors used Claude 4.6 for the purposes of developing GenAITutor.net, which was the primary data collection and analysis system. Claude 4.8 was also used to critique methods, analysis, and conclusions and contributed to the final editing process. The authors have reviewed and edited the output and take full responsibility for the content of this publication."